Charts
-
class
report_tools.charts.Chart(**kwargs)
Charts represent a view of your data. Charts are usually a graph of some sort, but may also contain arbitrary HTML (see the TemplateChart class)
Optional Chart Arguments
title
-
Chart.title
A “human-friendly” title for your chart. Note that this field will typically not be rendered in the chart itself - it is provided for use in the surrounding HTML. For example:
<h2 class="chart-title">{{ my_report.chart.title }}</h2>
<div class="chart-container">{{ my_report.chart }}</div>
If you want to embed a title in the chart itself, you should refer to the renderer documentation for your chosen rendering engine.
renderer
-
Chart.renderer
If you want the chart to use a different renderer to the one specified on the report, you can use this to pass in the appropriate renderer class.
renderer_options
-
Chart.renderer_options
Renderers will typically have a lot of specific customization options. This argument accepts a dictionary, which will be passed through to the renderer. For available options, check out the renderer documentation.
Built-in Chart Classes
PieChart
-
class
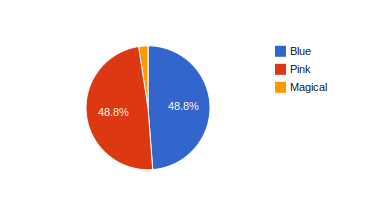
report_tools.charts.PieChart(width=None, height=None, **kwargs)
A standard pie chart. The corresponding get_data_for_xxx method should
provide a ChartData object with two columns. Column one should contain the data
point labels, and column 2 should contain numerical values.
Accepts two extra keyword arguments, width and height. These can be integers, floats or strings, depending on what your chosen rendering engine supports.
Example:
class MyReport(Report):
    renderer = GoogleChartsRenderer

    pie_chart = charts.PieChart(width=400, height=300)

    def get_data_for_pie_chart(self):
        data = ChartData()

        data.add_column("Pony Type")
        data.add_column("Population")

        data.add_row(["Blue", 20])
        data.add_row(["Pink", 20])
        data.add_row(["Magical", 1])

        return data
ColumnChart
-
class
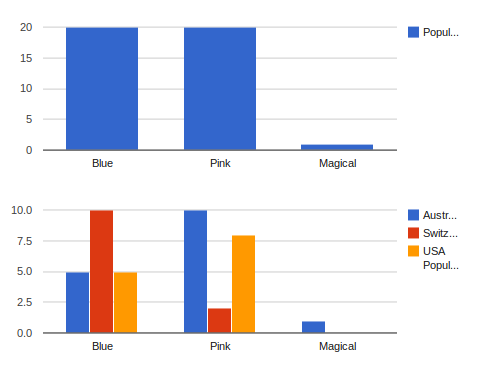
report_tools.charts.ColumnChart(width=None, height=None, **kwargs)
A standard vertical column chart. The corresponding get_data_for_xxx method should
provide a ChartData object with 1+n columns, where n is the number of data series
to be displayed. Column one should contain the data point labels, and subsequent columns
should contain numerical values.
Accepts two extra keyword arguments, width and height. These can be integers, floats or strings, depending on what your chosen rendering engine supports.
Example:
class MyReport(Report):
    renderer = GoogleChartsRenderer

    column_chart = charts.ColumnChart(title="Pony Populations", width="500")
    multiseries_column_chart = charts.ColumnChart(title="Pony Populations by Country", width="500")

    def get_data_for_column_chart(self):
        data = ChartData()

        data.add_column("Pony Type")
        data.add_column("Population")

        data.add_row(["Blue", 20])
        data.add_row(["Pink", 20])
        data.add_row(["Magical", 1])

        return data

    def get_data_for_multiseries_column_chart(self):
        data = ChartData()

        data.add_column("Pony Type")
        data.add_column("Australian Population")
        data.add_column("Switzerland Population")
        data.add_column("USA Population")

        data.add_row(["Blue", 5, 10, 5])
        data.add_row(["Pink", 10, 2, 8])
        data.add_row(["Magical", 1, 0, 0])

        return data
BarChart
-
class
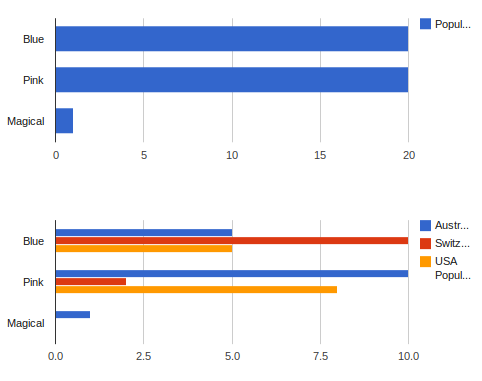
report_tools.charts.BarChart(width=None, height=None, **kwargs)
A standard horizontal bar chart. The corresponding get_data_for_xxx method should
provide a ChartData object with 1+n columns, where n is the number of data series
to be displayed. Column one should contain the data point labels, and subsequent columns
should contain numerical values.
Accepts two extra keyword arguments, width and height. These can be integers, floats or strings, depending on what your chosen rendering engine supports.
Example:
class MyReport(Report):
    renderer = GoogleChartsRenderer

    bar_chart = charts.BarChart(title="Pony Populations", width="500")
    multiseries_bar_chart = charts.BarChart(title="Pony Populations by Country", width="500")

    def get_data_for_bar_chart(self):
        data = ChartData()

        data.add_column("Pony Type")
        data.add_column("Population")

        data.add_row(["Blue", 20])
        data.add_row(["Pink", 20])
        data.add_row(["Magical", 1])

        return data

    def get_data_for_multiseries_bar_chart(self):
        data = ChartData()

        data.add_column("Pony Type")
        data.add_column("Australian Population")
        data.add_column("Switzerland Population")
        data.add_column("USA Population")

        data.add_row(["Blue", 5, 10, 5])
        data.add_row(["Pink", 10, 2, 8])
        data.add_row(["Magical", 1, 0, 0])

        return data
LineChart
-
class
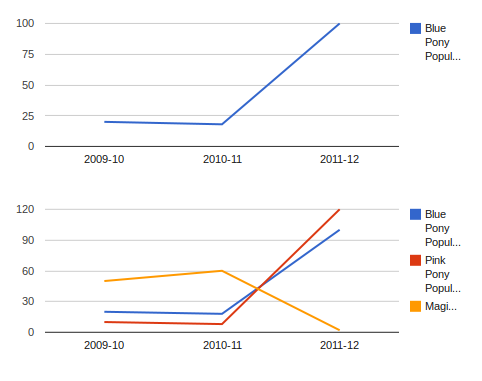
report_tools.charts.LineChart(width=None, height=None, **kwargs)
A standard line chart. The corresponding get_data_for_xxx method should
provide a ChartData object with 1+n columns, where n is the number of data series
to be displayed. Column one should contain the data point labels, and subsequent columns
should contain numerical values.
Example:
class MyReport(Report):
    renderer = GoogleChartsRenderer

    line_chart = charts.LineChart(title="Blue Pony Population - 2009-2012", width="500")
    multiseries_line_chart = charts.LineChart(title="Pony Populations - 2009-2012", width="500")

    def get_data_for_line_chart(self):
        data = ChartData()

        data.add_column("Test Period")
        data.add_column("Blue Pony Population")

        data.add_row(["2009-10", 20])
        data.add_row(["2010-11", 18])
        data.add_row(["2011-12", 100])

        return data

    def get_data_for_multiseries_line_chart(self):
        data = ChartData()

        data.add_column("Test Period")
        data.add_column("Blue Pony Population")
        data.add_column("Pink Pony Population")
        data.add_column("Magical Pony Population")

        data.add_row(["2009-10", 20, 10, 50])
        data.add_row(["2010-11", 18, 8, 60])
        data.add_row(["2011-12", 100, 120, 2])

        return data
TemplateChart
-
class
report_tools.charts.TemplateChart(template, **kwargs)
This chart simply renders a given template. The get_data_for_xxx method
should return a dictionary context. An extra context variable ‘chart_id’ will
be provided, which should be used if a unique identifier is required in the
template. Note that the template chart does not require a renderer.
Accepts one required argument, template.
Example:
class MyReport(Report):
    template_chart = charts.TemplateChart(template="myapp/template_chart.html")

    def get_data_for_template_chart(self):
        pony_types = [
            ('Blue', 'Equus Caeruleus'),
            ('Pink', 'Equus Roseus'),
            ('Magical', 'Equus Magica')
        ]

        template_context = {
            'pony_types': pony_types
        }

        return template_context
<!-- myapp/template_chart.html -->

<table id="{{ chart_id }}" border="1">
    <thead>
        <th>Pony Type</th>
        <th>Latin Name</th>
    </thead>
    <tbody>
        {% for pony_type, latin_name in pony_types %}
            <tr>
                <td>{{ pony_type }}</td>
                <td>{{ latin_name }}</td>
            </tr>
        {% endfor %}
    </tbody>
</table>